The Postgres Dashboard You've Always Wanted
Real-time visibility into queries, activity, locks, storage and so much more - so you find the problem before your users do.
Ready to go in just three minutes
Sign up.
Start a 14-day free trial. No credit card required.
Install the agent.
One small binary, running anywhere that can reach your database.
Watch the dashboard.
Queries, activity, vacuum, storage and more - live.
See where the time went.
Always-on monitoring of your query statistics, VACUUMs, tables, indexes, replication and more.

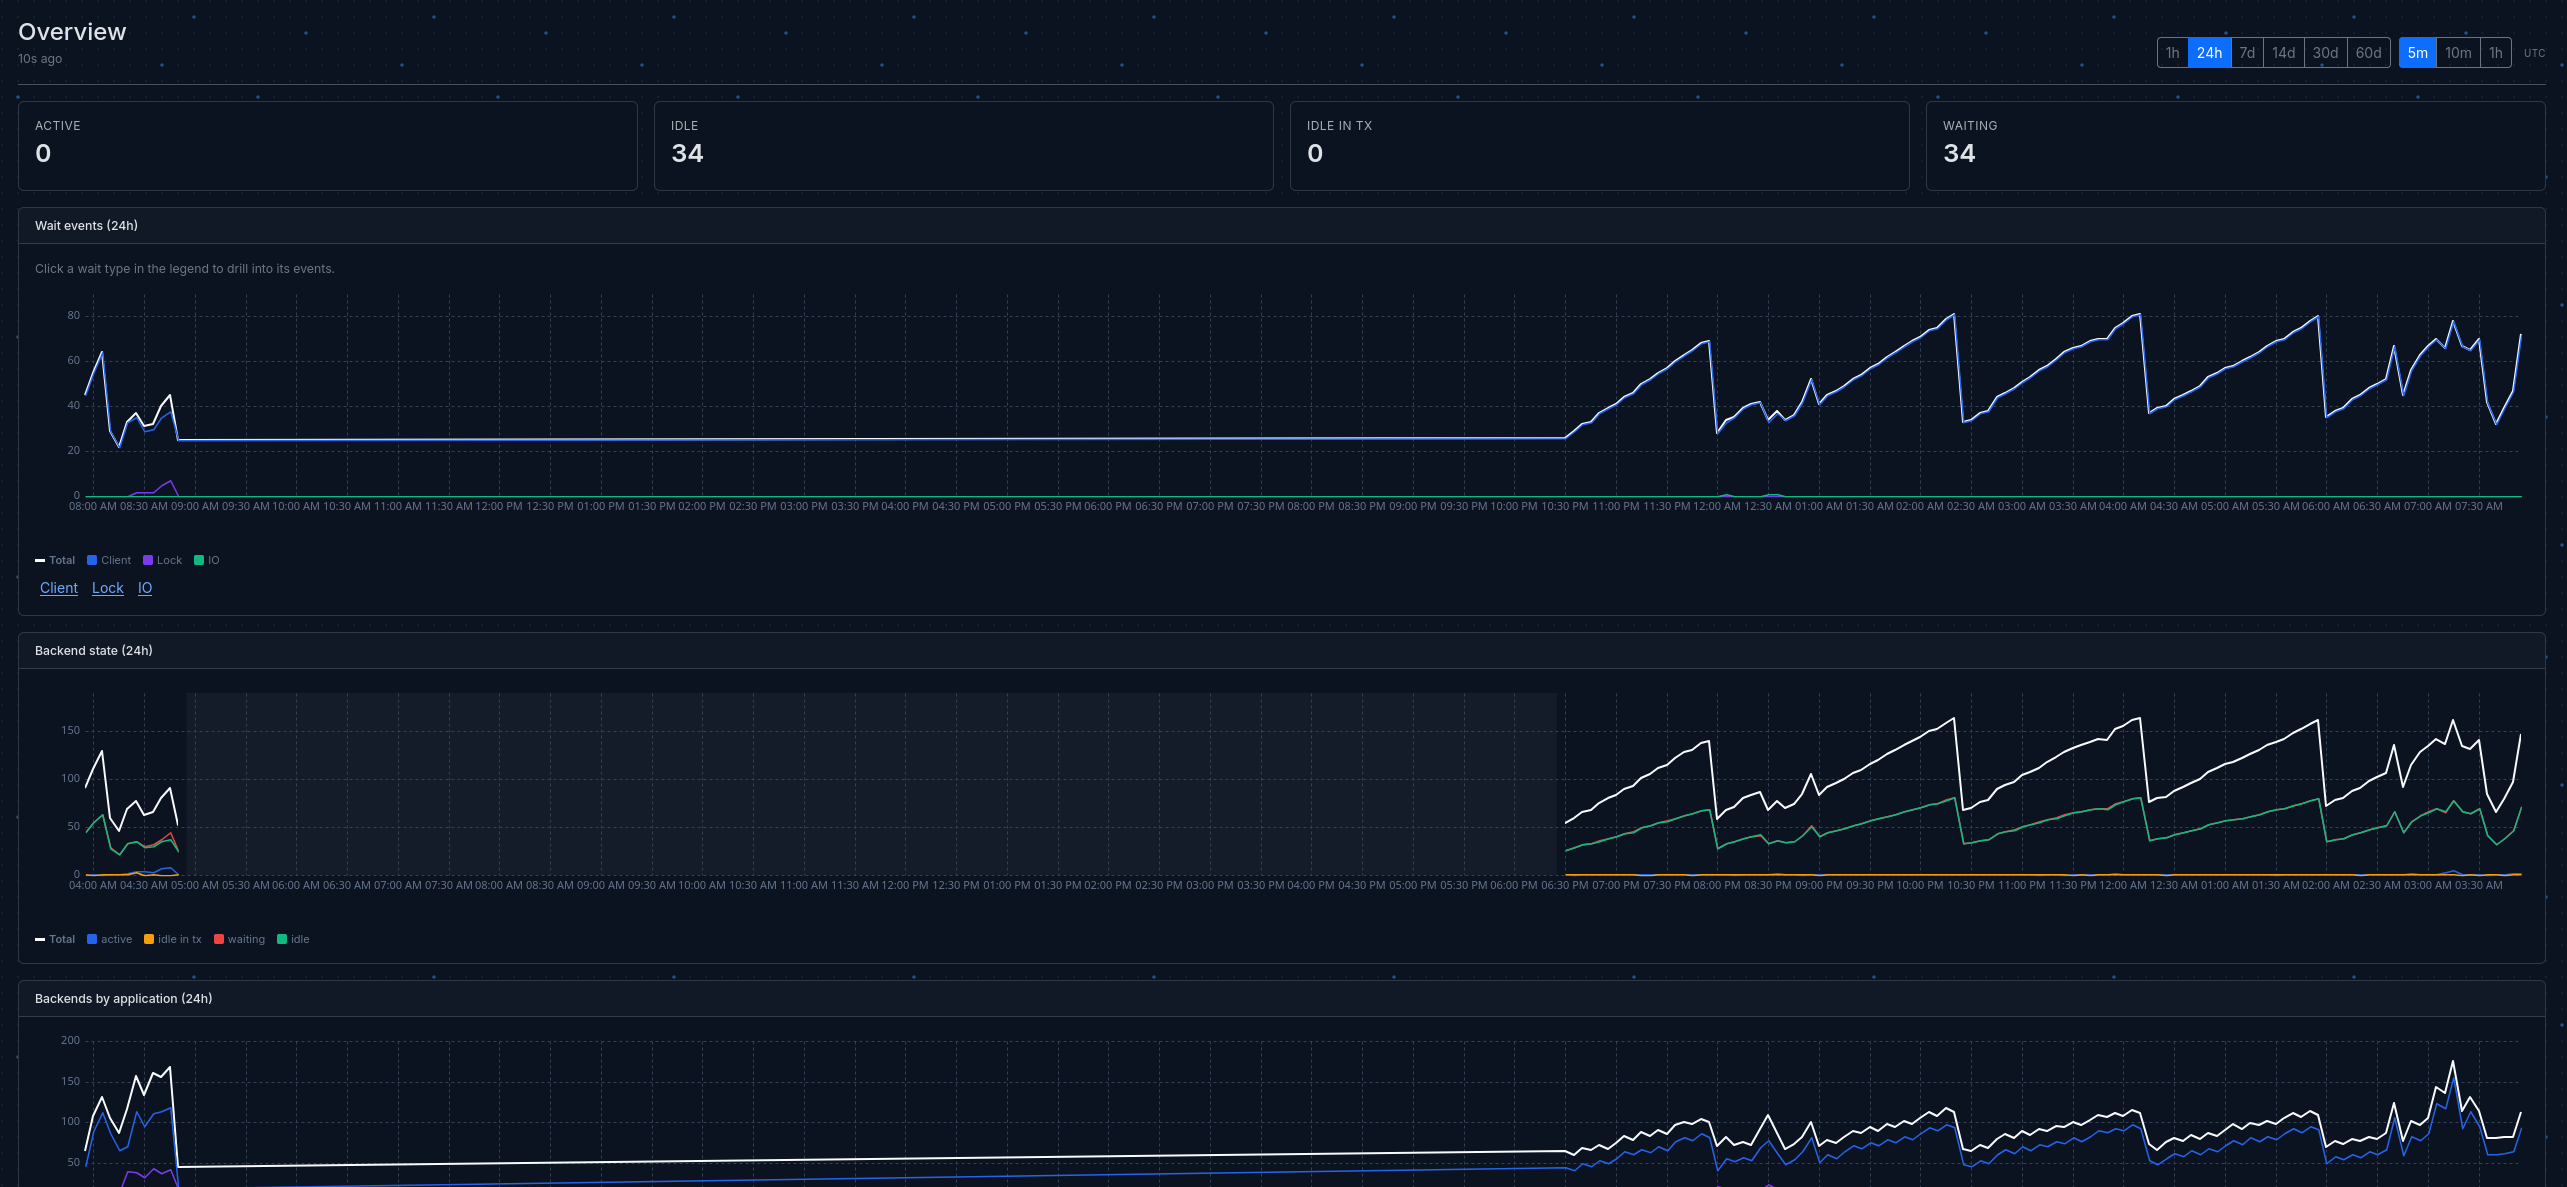
Debug ongoing issues at a glance.
Live connection states, wait events, lock waits, and the long-running queries, lock chains and more at a glance.
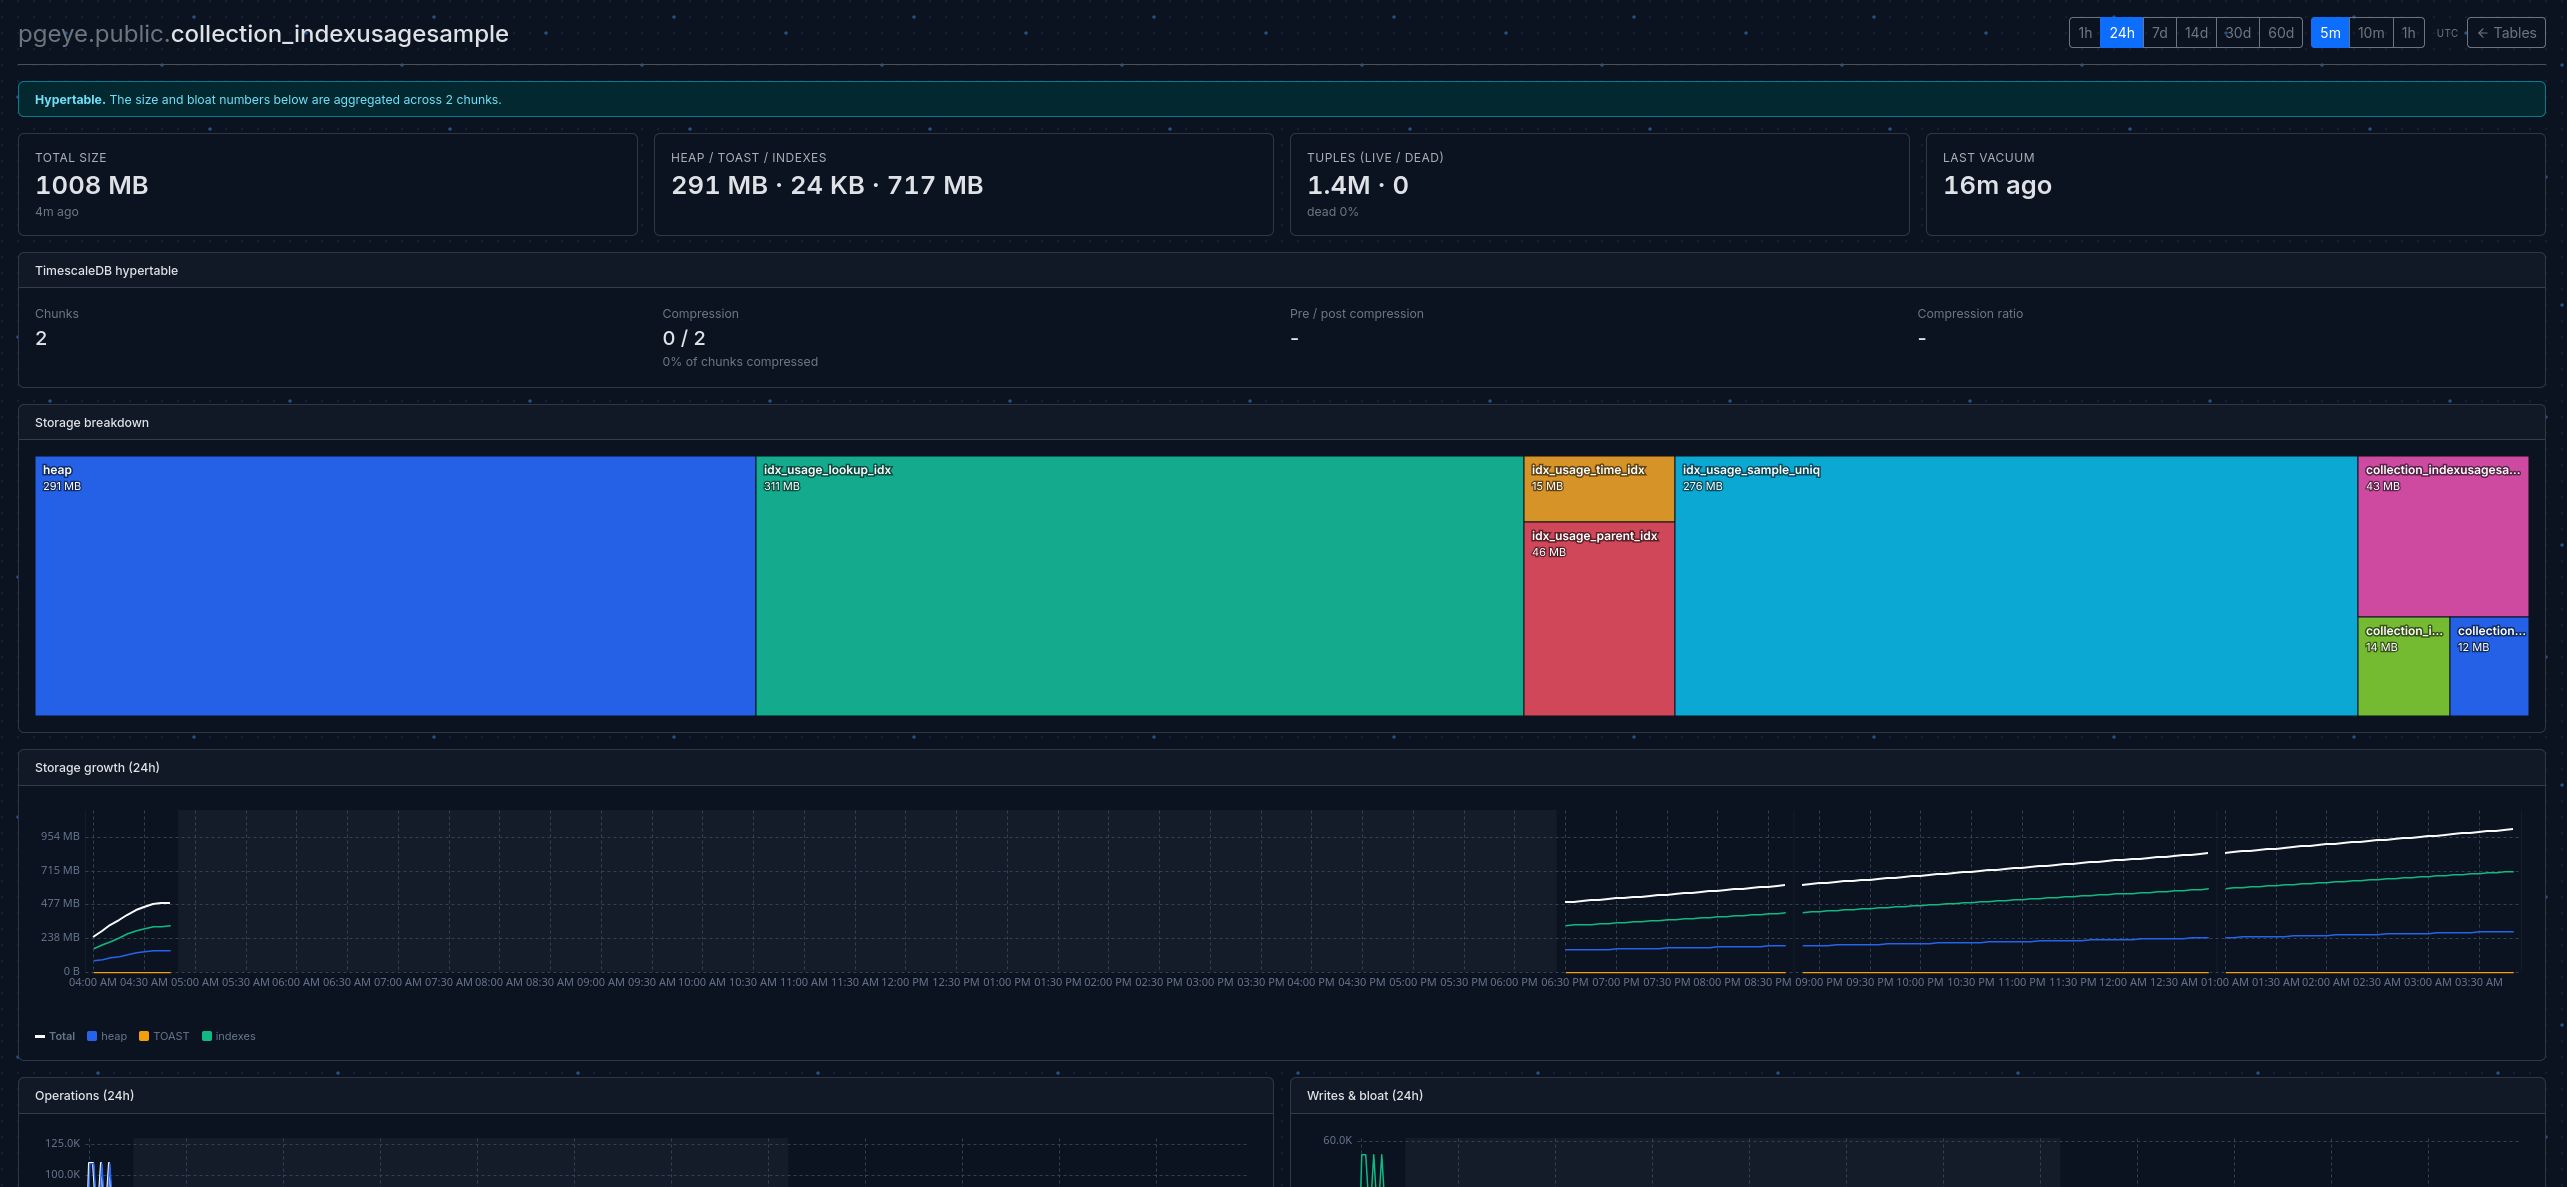
Catch storage problems early.
Per-table size, dead-row ratios, vacuum cadence, growth over time and much more. Find the table that's about to need attention before autovacuum gives up.
SELECT *
FROM users
WHERE email = 'alice@example.com'
AND password_hash = '$2b$12$...'SELECT *
FROM users
WHERE email = $1
AND password_hash = $2Your data stays on your side of the wire.
The agent runs inside your network and only makes outbound calls. We never connect to your database, ever - there's nothing to firewall, nothing to grant inbound access to.
Query text is fingerprinted and normalized at the agent before anything leaves the host. Literals, parameters, and identifiers are stripped - so what reaches pgeye is the query's shape, not its data.
Partitions and hypertables, rolled up by default.
Other tools show your events table as 200 rows of
_hyper_42_*_chunk noise, each with a fraction of
the real counters. pgeye understands your partitions and even
Timescale Hypertables.
The result: one row for the table that exists in your schema, with totals that match reality - and a one-click expand when you actually want to see the chunks.
| events | 0 calls |
| _hyper_42_3001_chunk | 1.2M |
| _hyper_42_3002_chunk | 980K |
| _hyper_42_3003_chunk | 850K |
| … 197 more rows | |
| events hypertable · 200 chunks | 12.4M |